Berkeley Marriage Pact - Data Analysis
25 Feb 2020The Berkeley Marriage Pact
Dating apps, at least it seems to me, operate on perverse incentives. Take two Tinder users who are matched together. They go on a date together, sparks fly, and love blossoms. They start dating, get married, and never open Tinder again. Years pass and the app is eventually uninstalled. In their success lies Tinder’s loss.
The true optimal strategy for Tinder and other dating apps is to keep users swiping for as long as possible. Feed users matches who are almost compatible. Keep them crawling back to shoot their shot. Keep them pulling on the lever of the slot machine.
At least, this was the thesis on which the Berkeley Marriage Pact was built. The idea was simple. Write a survey, have Berkeley students take it, and match people based on survey responses. And unlike dating apps, we have no ulterior motive. Our sole goal was to maximize the number of relationships.
All in all, we had more than 3,000 responses, of which about 2500 confirmed their emails. In the end we made about 1300 matches. While the success of these matches is still not clear, we would like to present some interesting findings from the data.
TL;DR
If you’re too lazy to read everything, I’ve organized the parts of this post that absolutely scintillate into clickbait titles for your enjoyment:
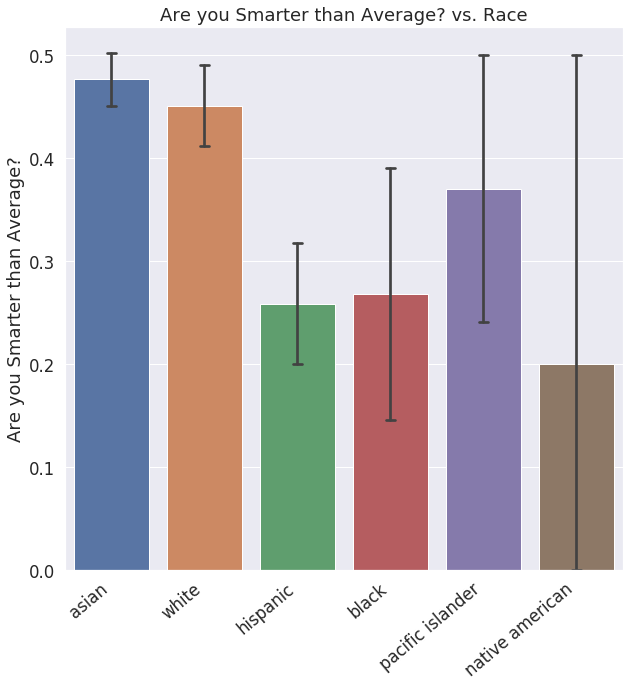
- Only 30% of women, 26% of Hispanics, and 27% of Blacks think they are smarter than average. 60% of men think they are smarter than average.
- There seems to be a very depressed portion of Berkeley.
- The more extreme your political views, the more extreme your sex life.
- Choice of Alcohol.
- Fish people are the most confident.
- Sex.
- The part where we laugh at the Right.
- Dunning-Kruger.
Table of Contents
- The Data
- Loss of Innocence
- Sex, Sexuality, and Sexual Partners
- Political Affiliation
- Health and Lifestyle
- Are you smarter than the Average Bear?
The Data
We asked 43 questions, ranging from “religious affiliation” to “boba consumption.” All data revealed in this post will be in aggregate and no individual data should be recoverable. If you have any concerns please let us know through email.
This post mainly contains interesting correlations and trends in the data. You can see a presentation of just the aggregate responses here.

Loss of Innocence
“If a body meet a body coming through the rye”
– Rabbie Burns, “Comin thro’ the Rye”
It’s not entirely surprising that there is a loss of innocence as people go through college, although it’s mildly interesting that we are able to quantify and graph this loss of innocence.
Let’s start with the sexual stuff:
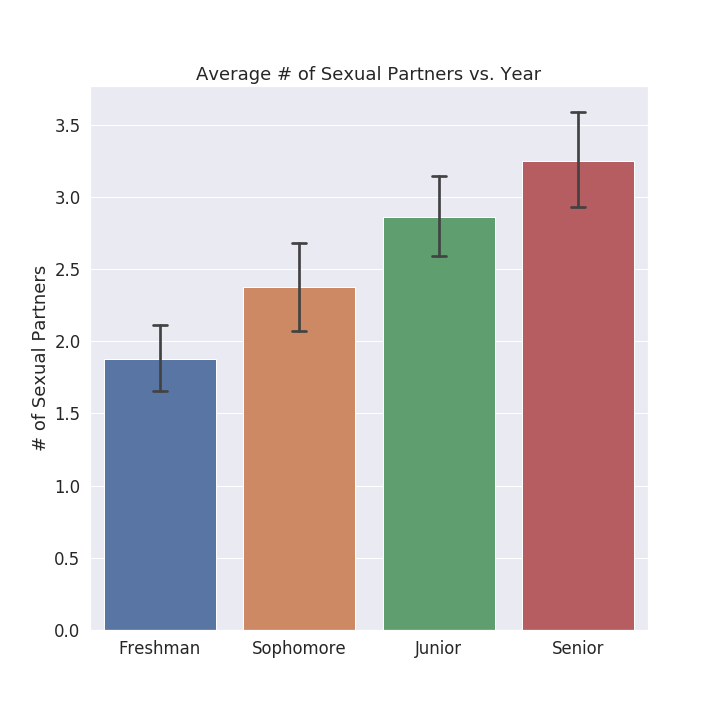
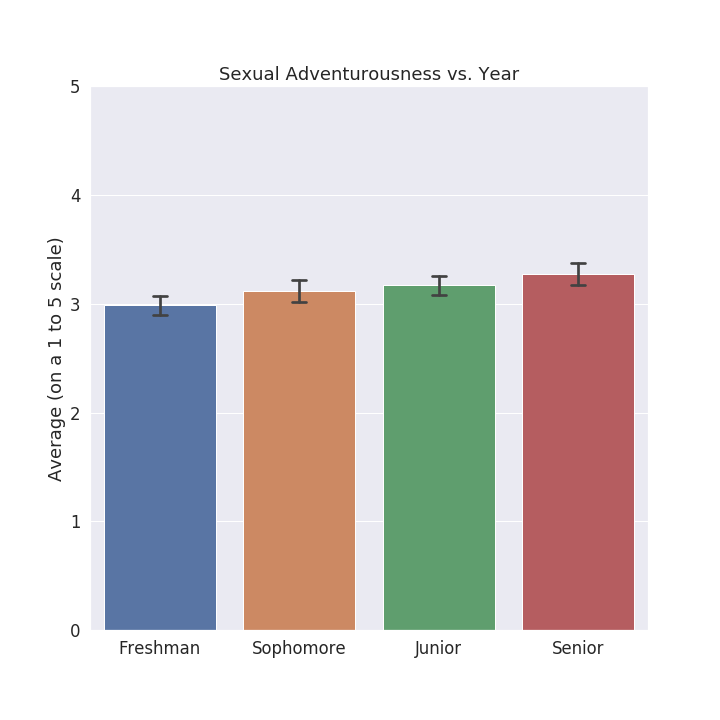
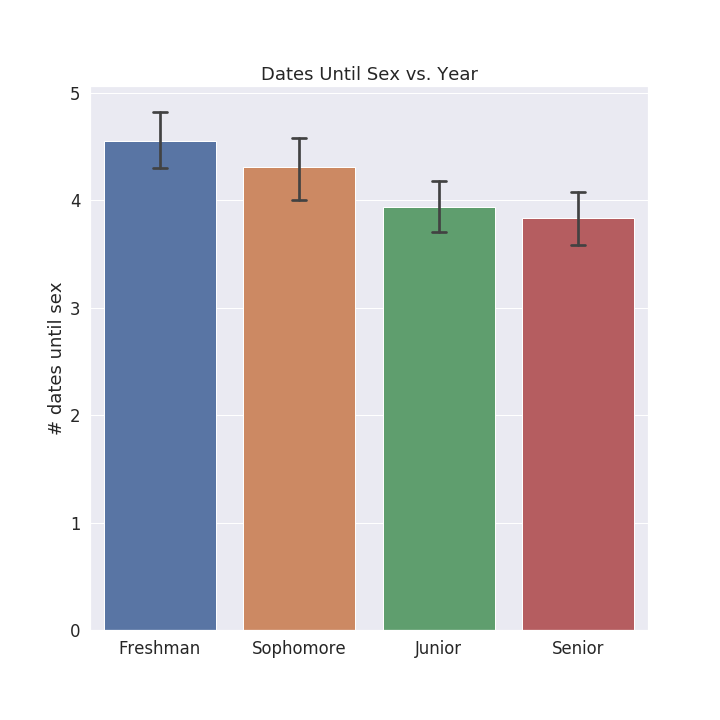
So all in all, people have had more sexual partners, become more sexually adventurous, and get more desperate as they grow older. It’s probably as good a time as any to point out that the error bars capture a 95% confidence interval.
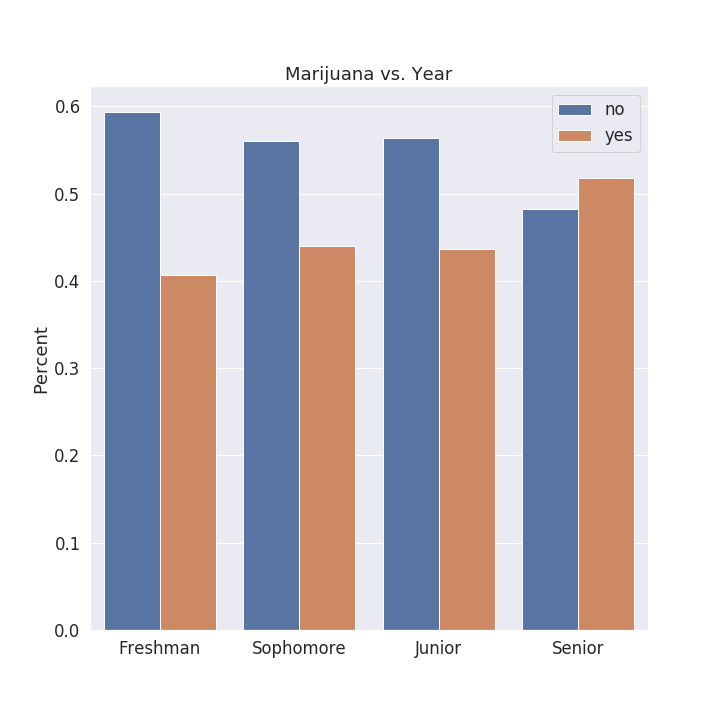
Substance Abuse
We can also take a look at various substances that people put in their bodies:
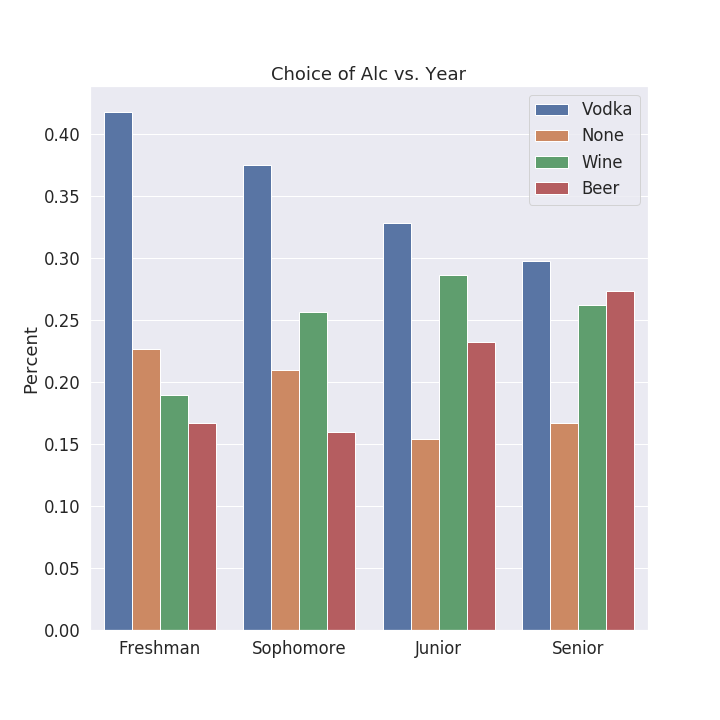
It’s interesting to note that vodka preference drops drastically with age. Perhaps fueled by the “omg I fucking love to drink, vodka is my favorite, I’m so cool” to “holy shit I’m literally just guzzling industrial grade solvents what am I doing with my life” transition that most people go through.
I also like how “Wine” peaks in Junior year and “Beer” just keeps rising, as if people go from “I love vodka” to “I’m fancy as fuck” to “I just don’t care anymore”.
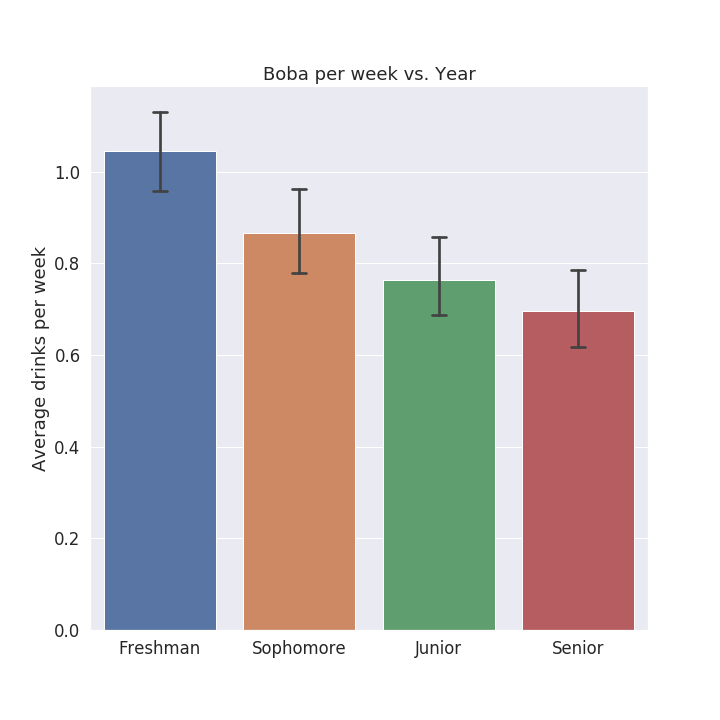
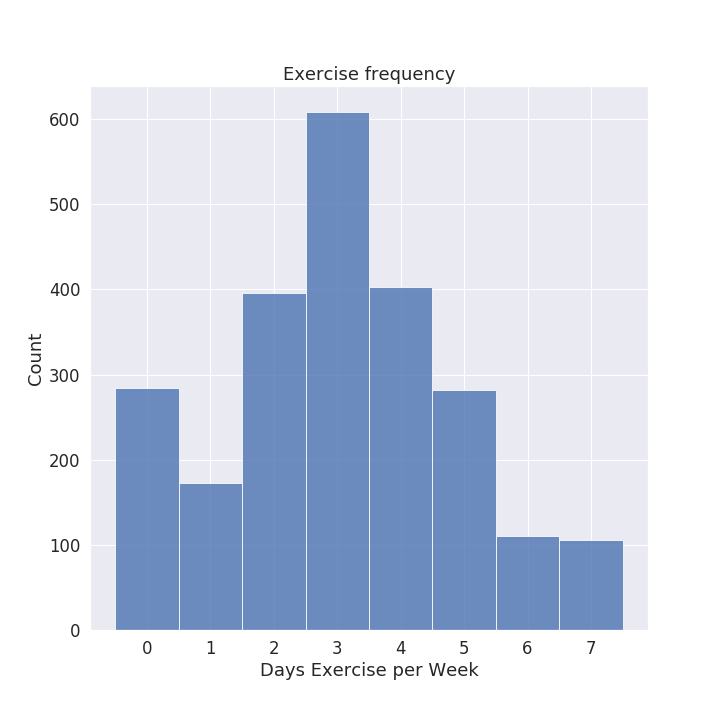
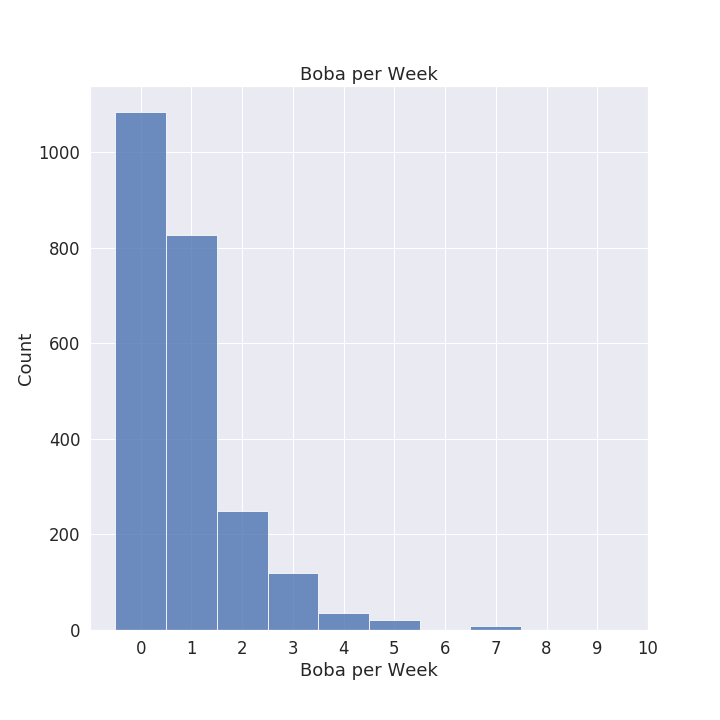
It’s interesting how boba consumption drops off as well, perhaps because seniors have finally come to terms with the fact that they can’t put just anything in to their bodies. In a similar vein, it seems that people actually live healthier lifestyles as they age:
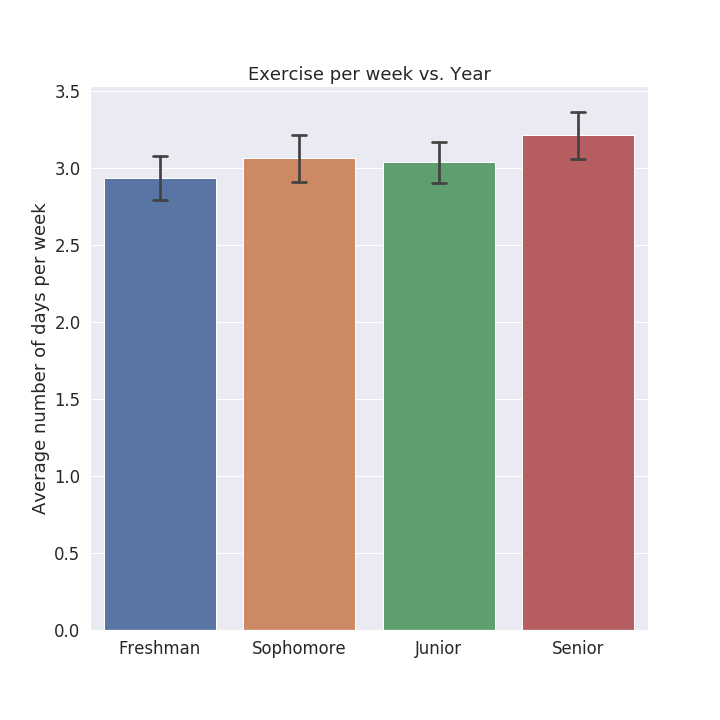
As a side note, while these differences seem small you have to remember that it’s really the error bars that tell the story. While the increase in absolute days of exercise is small the error bars show that this increase is statistically significant.
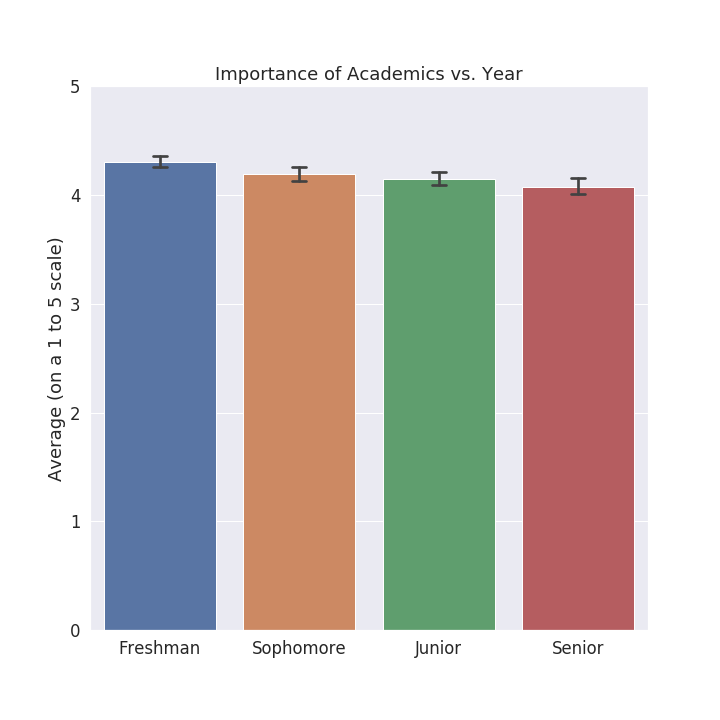
Finally, perhaps the saddest graph in the section, we see Berkeley slowly crushing the intellectual curiosity and academic vitality out of her students. Or at least seniors just care about things a whole lot less:
Sex, Sexuality, and Sexual Partners
“He toss my salad like his name Romaine”
– Nicki Minaj, “Anaconda”
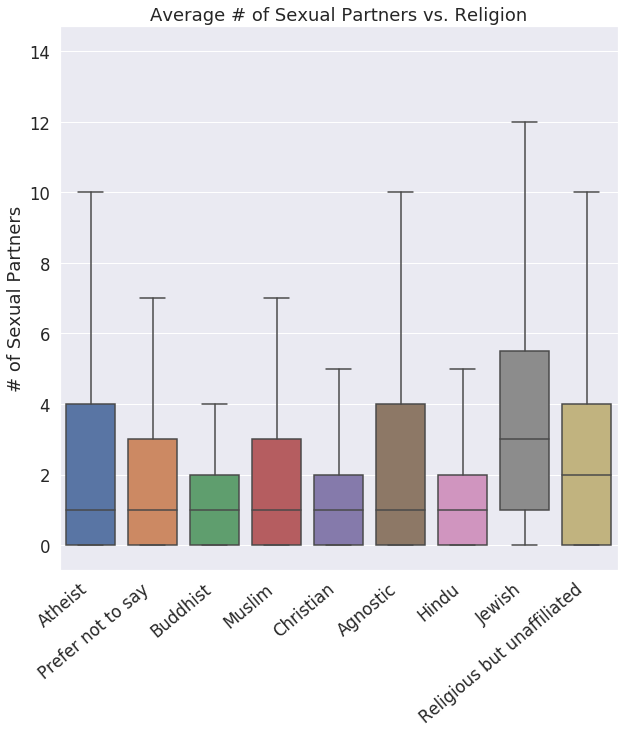
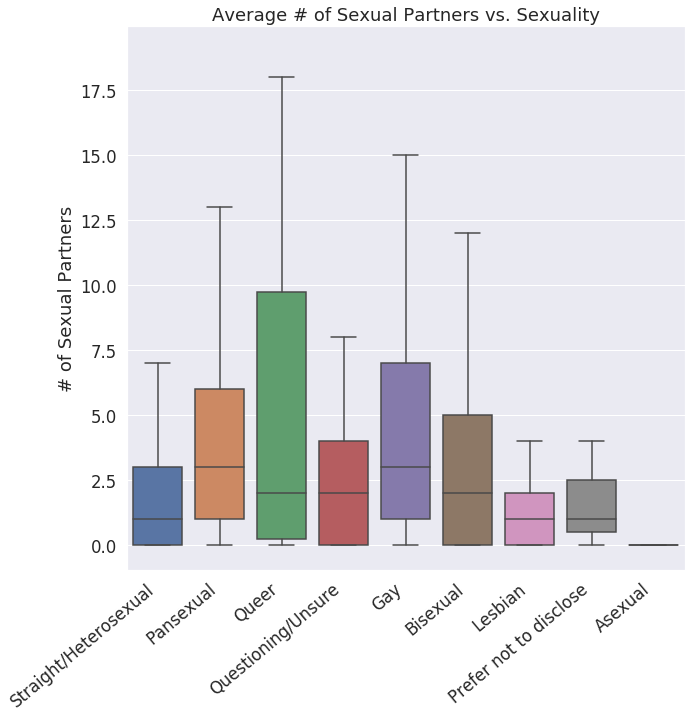
My lawyers advised me not to say too much in this section, so here are some box and whisker plots (with the outliers removed):
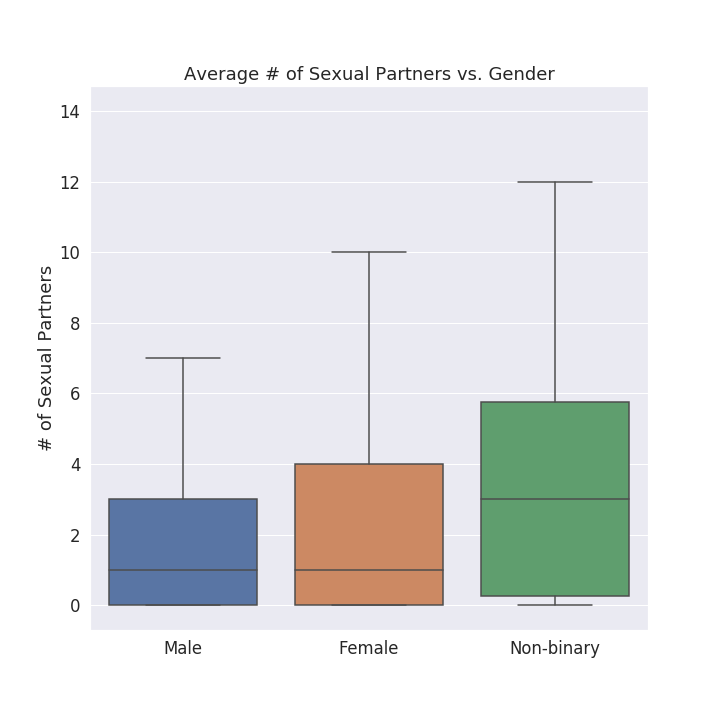
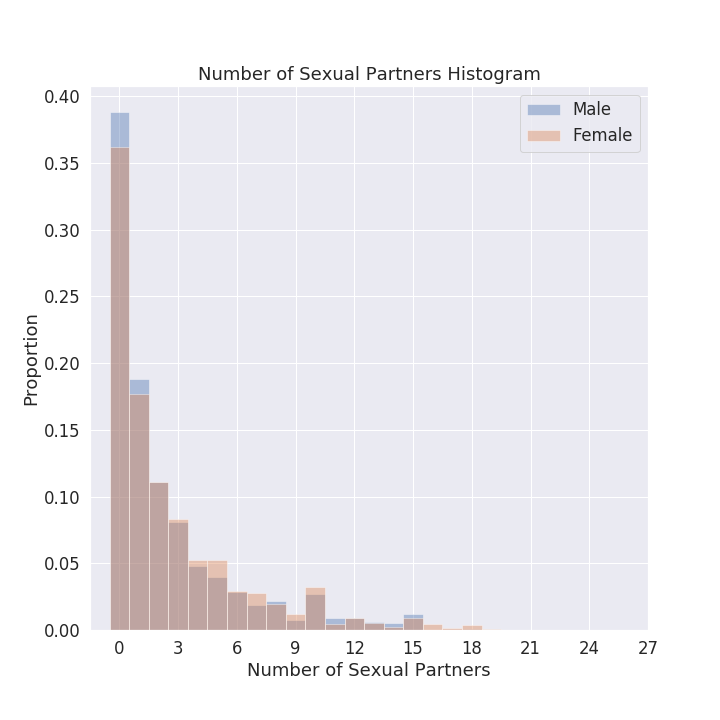
And the distributions for male and female:
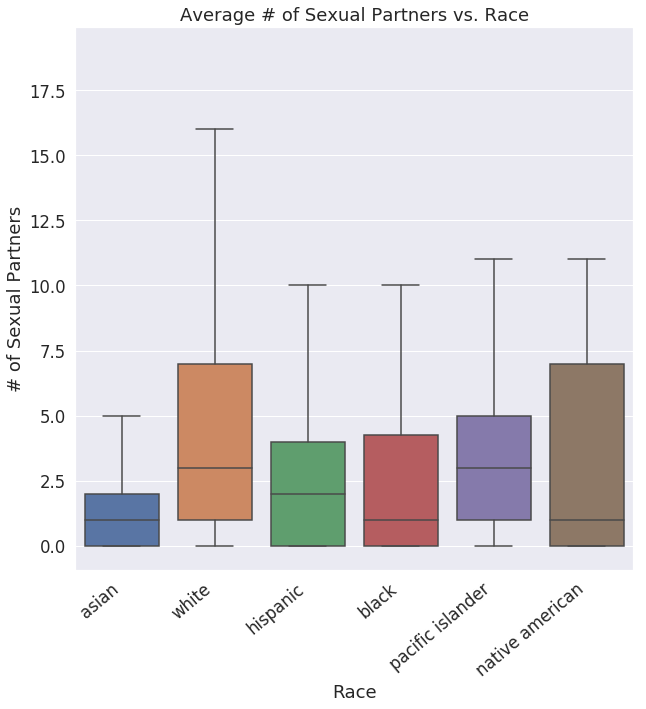
More boxplots:
If we plot out “number of sexual partners” against “importance of academics” we get an interesting trend:
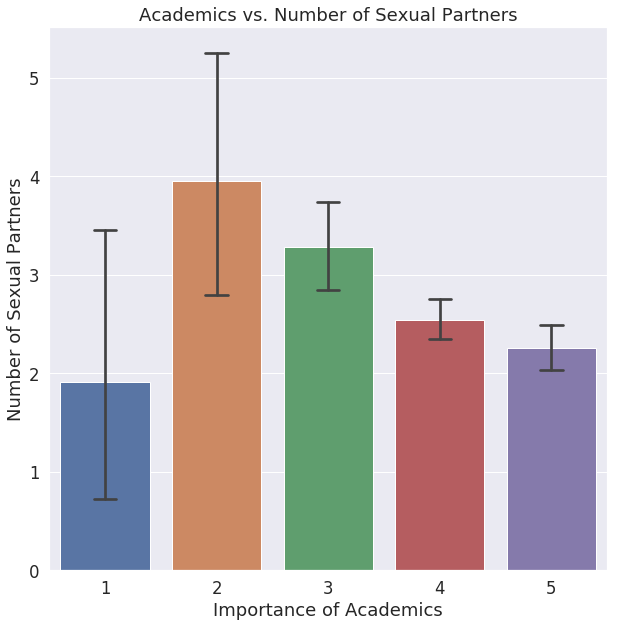
It’s sort of sad to see that there seems to be a rather depressed portion of Berkeley students that are not only apathetic towards academics, but can’t get any sex either. You would think the relationship should be the other way around (students that don’t care about academics should have boat-loads of sex), and this is true except for the students who just don’t care about academics at all.
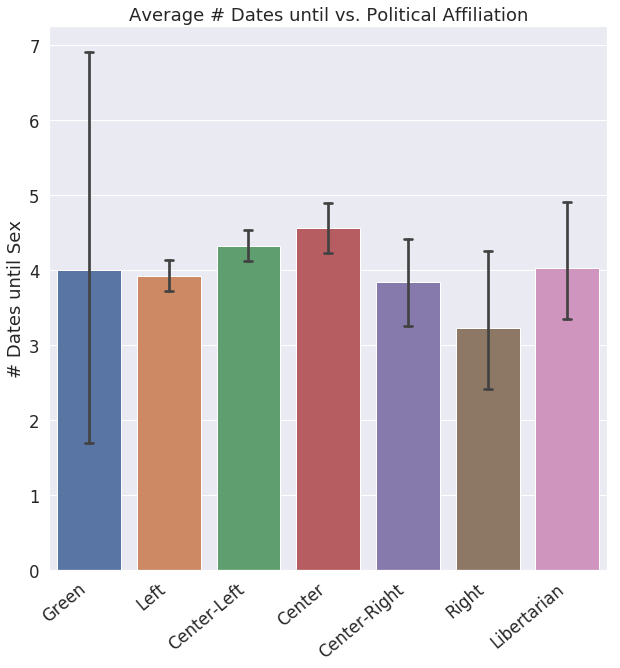
This is probably one of my favorite plots:
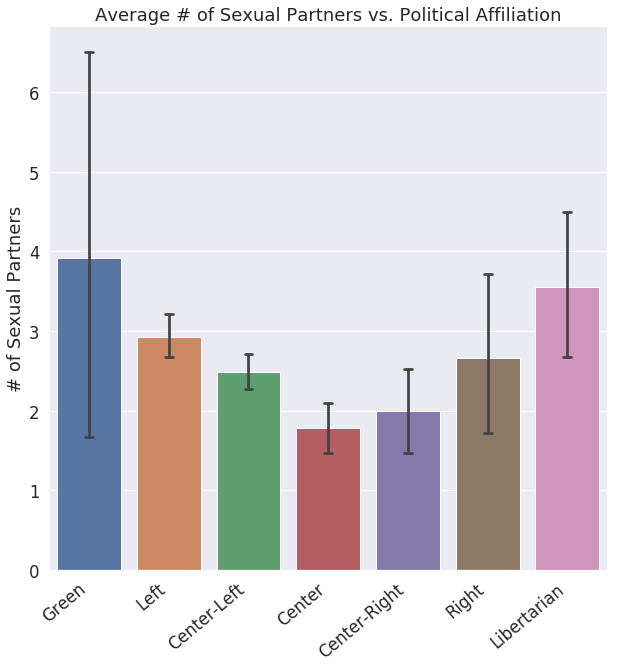
Look at how beautiful this U-shape is. The underlying mechanism here is probably that politically extreme people are also extreme in other parts of their lives.
Political Affiliation
“the night wind hammering about their siren scream and their mighty metal thunder!”
– Ray Bradbury, “Fahrenheit 451”
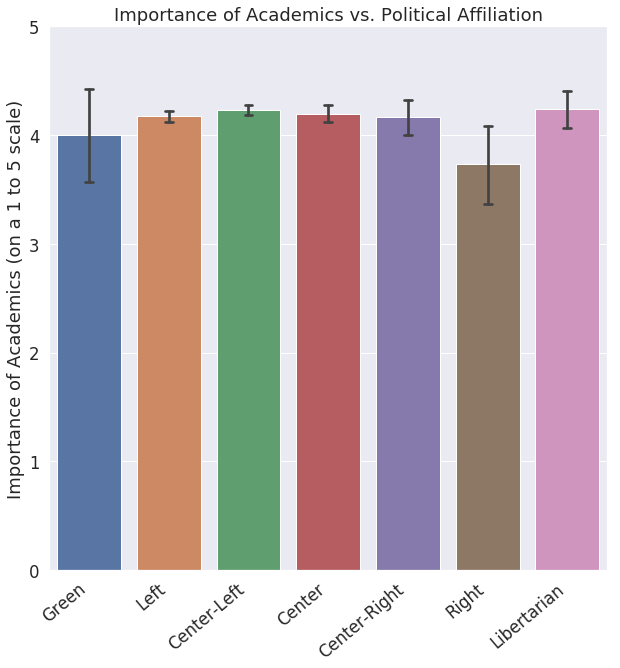
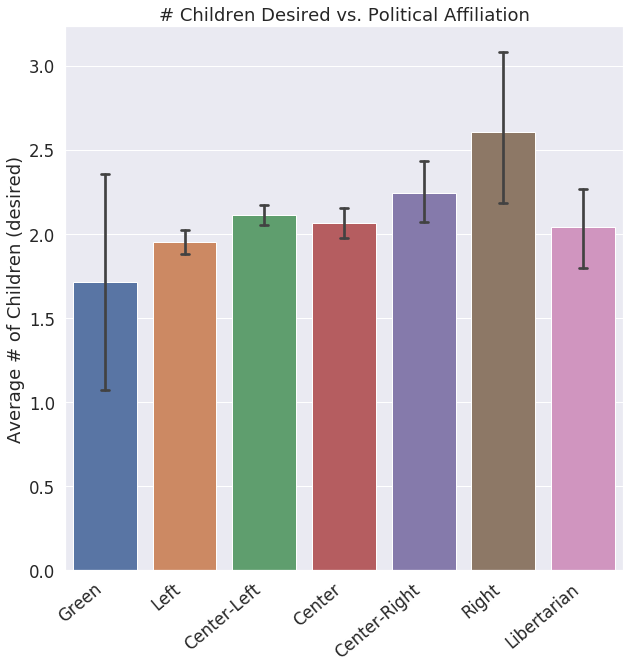
This is the part of the post where we simultaneously marvel at how the Right basically writes our jokes for us and try not to be featured on “Fox and Friends.”
Health and Lifestyle
“But if snow is like skin: it pulls away, so easy, dragged from the body / What if all stripped wood is branches and all frozen lakes are water?”
– Jordaan Mason, “Avalanches”
Berkeley students are surprisingly healthy:
Are you Smarter than the Average Bear?
“I’m smarter than the av-er-age bear!”
– Yogi Bear
The last question we asked was “Are you smarter than the average (Cal) Bear?” 46.2% of people responded yes to this question, but things start to get interesting when you break down the results by other categories. For example, let’s start with gender. We plot the proportion of people that answered “yes” to the question:
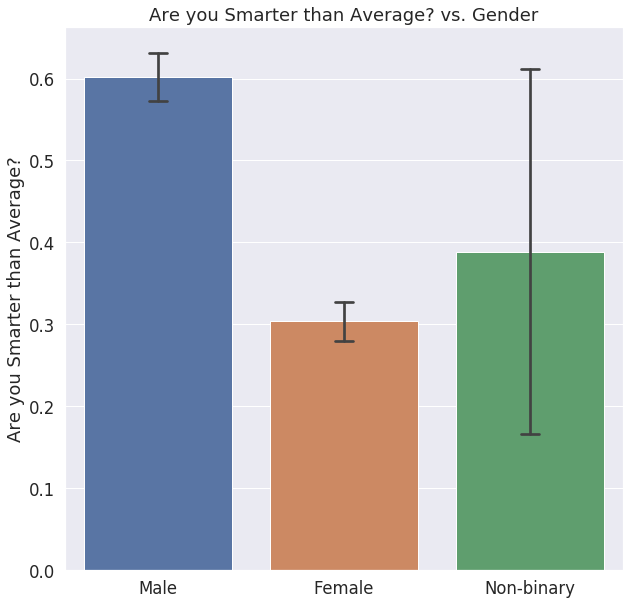
60% of men say they are smarter, while only 30% of women think they are smarter than average. The difference is stark. The percentages are even worse if we look at race:
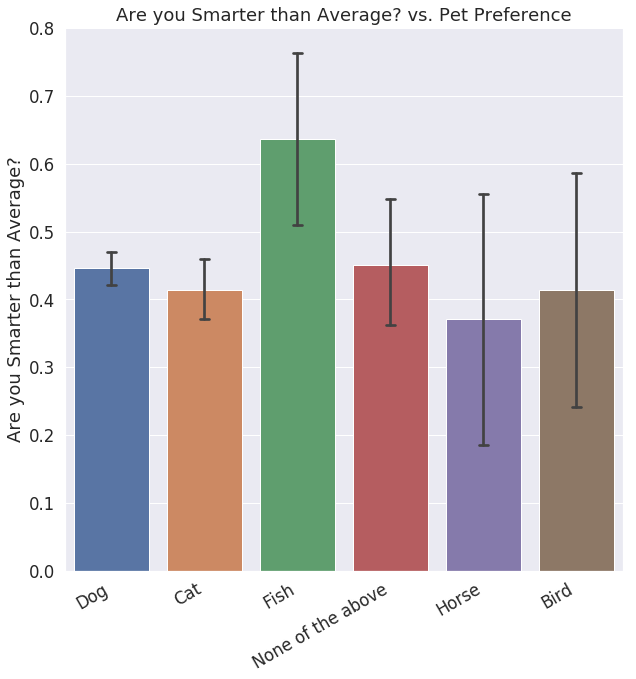
On a lighter note it seems that fish-people are for some strange reason very confident:
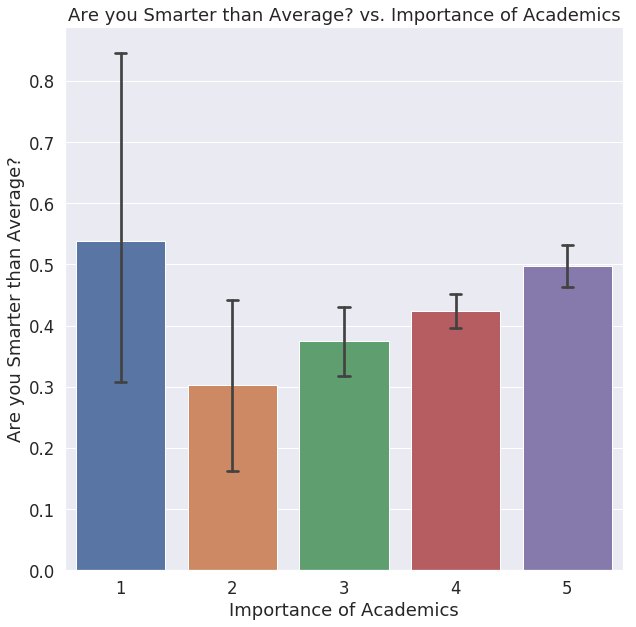
Finally, if we break the data down by “Perceived importance of academics” we get an interesting Dunning-Kruger-esque trend: